TL;DR
Moving from static, siloed spreadsheets to a rolling forecast with one source of truth cut cycle time, improved accuracy, and let managers act in period instead of after month-end.
Key takeaways
- Small shifts in utilisation and realisation move margin disproportionately.
- A rolling forecast turns reporting into action.
- Quote discipline + scope hygiene reduce hidden write-downs.
- Rebalance capacity before hiring.
- Give managers the levers (+2% rate, ±3pp utilisation) in simple views.
The challenge
Siloed files, conflicting versions, and slow month-end rollups meant that decisions often lagged behind reality. The team needed one source of truth, a rolling horizon, and clear accuracy metrics.
Executive objectives
- Speed: Reduce forecast cycle time from weeks to days.
- Reliability: Improve accuracy and reduce bias; fewer surprises.
- Transparency: Make drivers, assumptions and changes visible.
- Adoption: Enable managers with a clear process and simple views.
Our approach
- Model rebuild: Central driver model (revenue, salaries, overheads) with BU/role granularity; CSV import first, later automated feeds.
- Rolling cadence: Always-on horizon (12–18 months), monthly refresh, mid-month checkpoint on high-variance items.
- Accuracy framework: Track MAPE, bias, and “within ±2%” reliability; investigate root causes.
- Governance: Rate floors, approval paths, change logs; suppress silent write-downs.
- Enablement: 45-min live demo + quick-reference for each role.
Methodology & formulas (plain English)
- MAPE = average of
abs(Actual − Forecast) ÷ Actual(by month/BU). - Bias = average of
(Forecast − Actual) ÷ Actual(sign shows direction). - Cycle time = days to Build → Consolidate → Review → Publish.
- Reliability = share of line items within a tolerance band (e.g., ±2%).
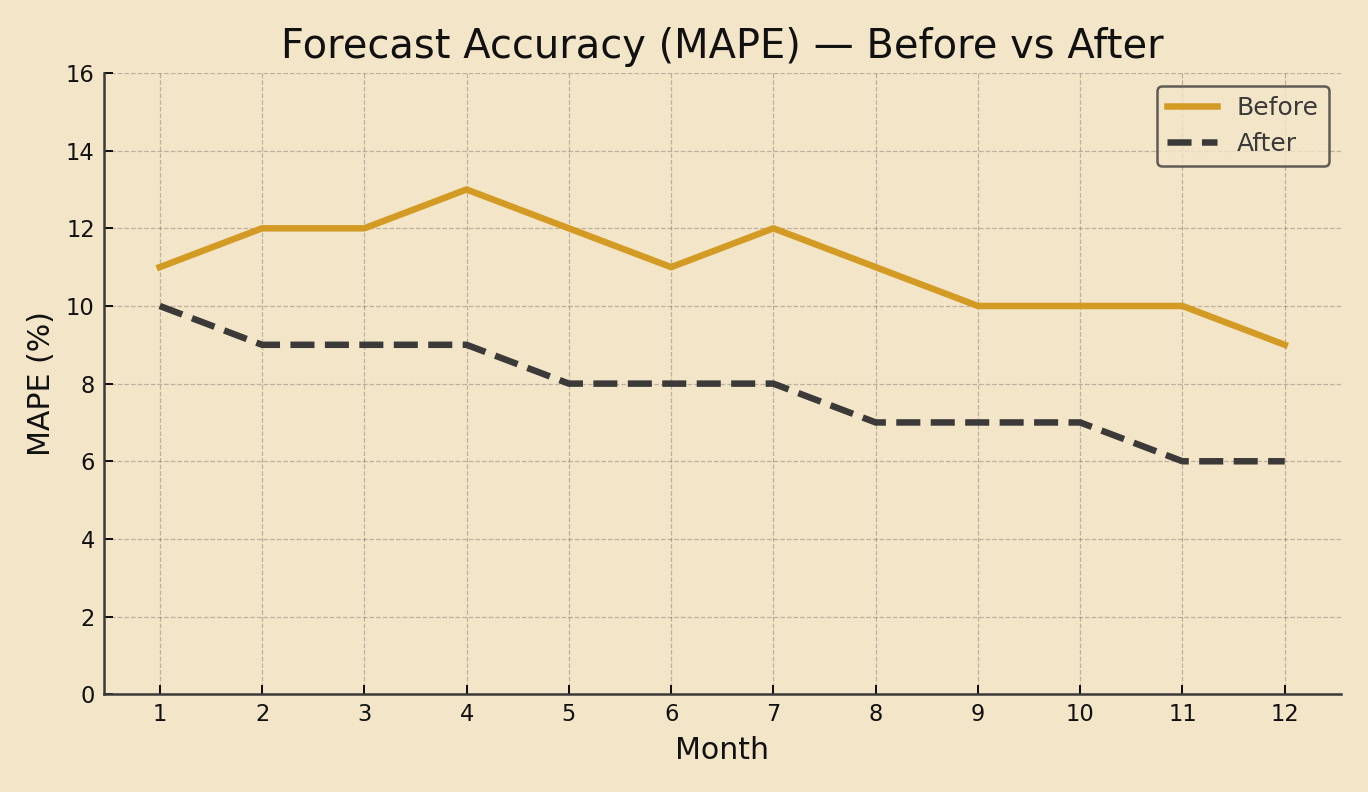
Figure 1 Forecast Accuracy (MAPE) Before vs After

Figure notes: Twelve-month view showing steady improvement after roll-out and governance.
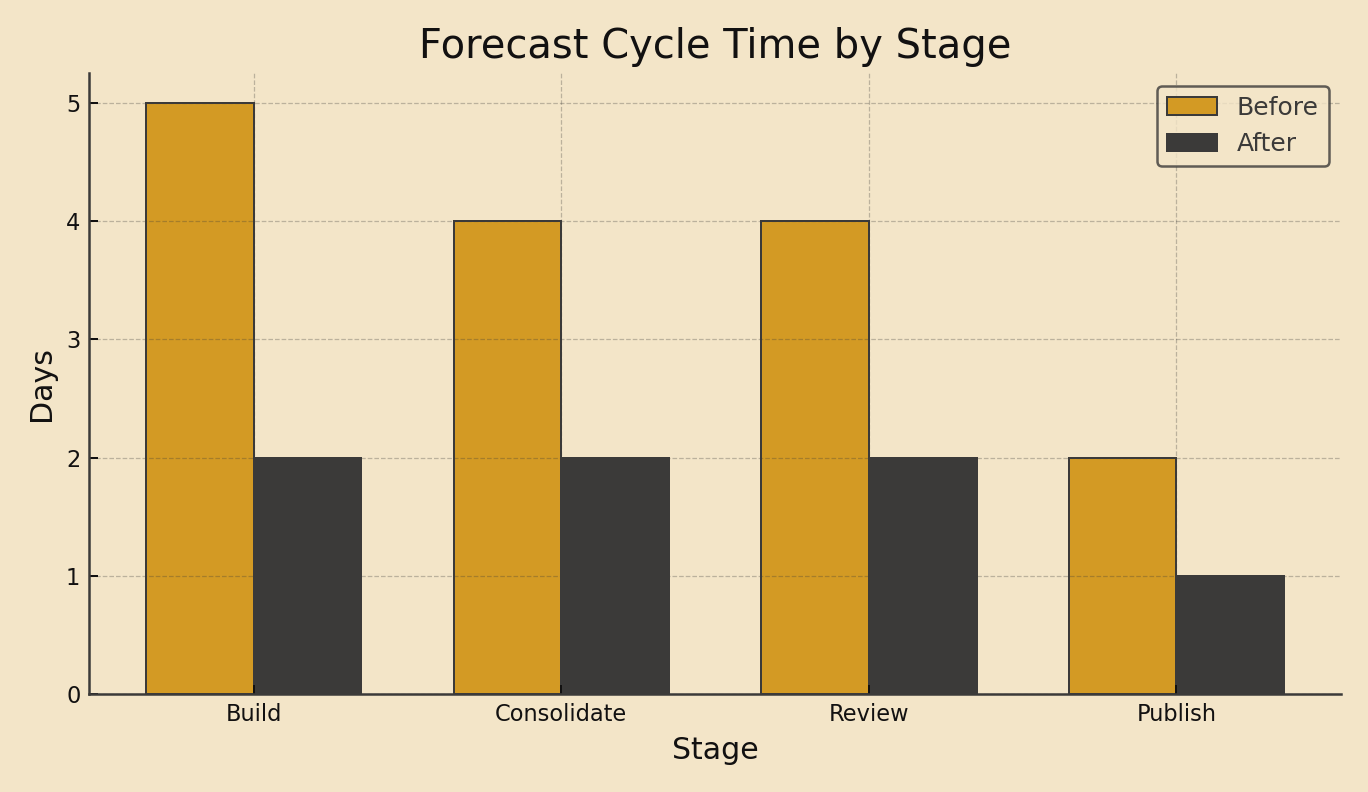
Figure 2 Forecast Cycle Time by Stage

Figure notes: Reduction achieved by using standard inputs, one source of truth, and early stakeholder reviews.
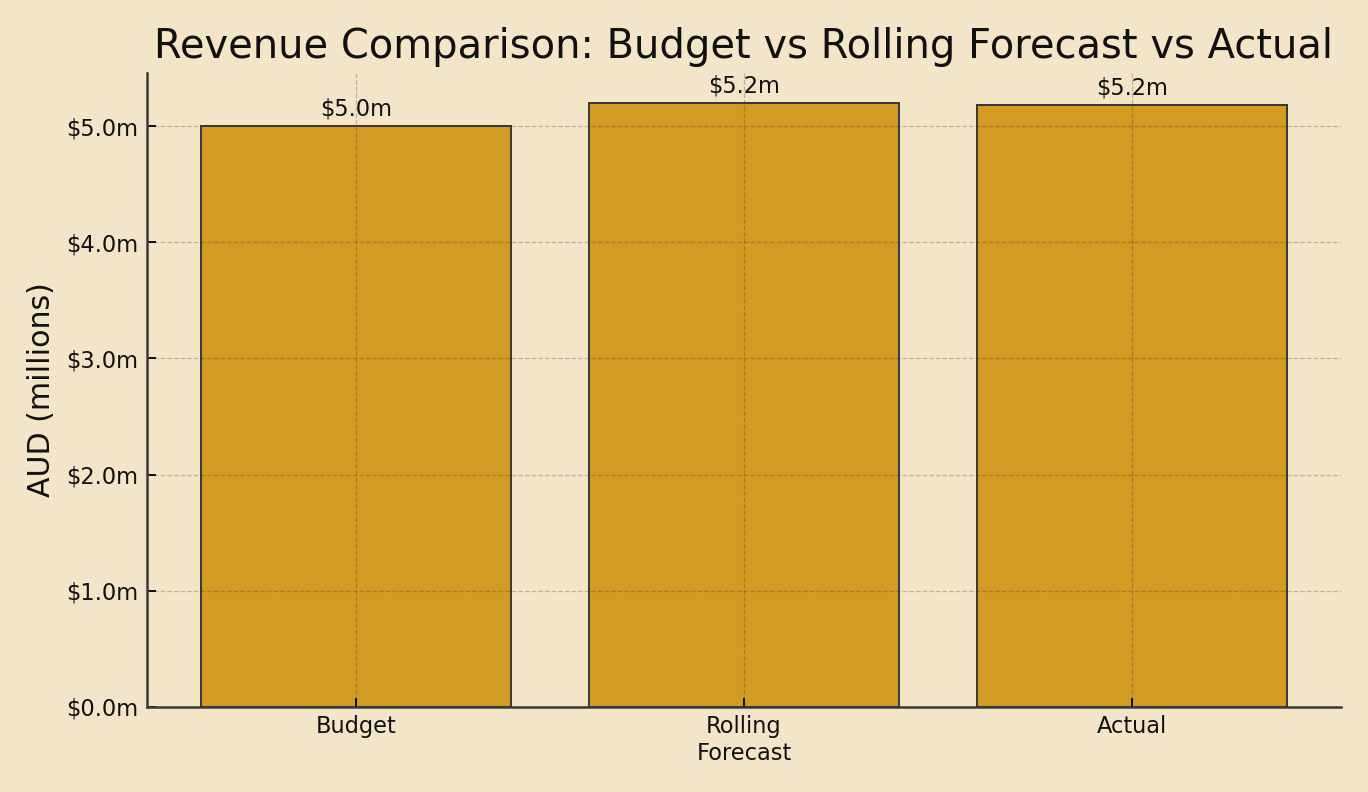
Figure 3 Revenue: Budget vs Rolling Forecast vs Actual

Figure notes: Rolling forecast tracks reality more closely than static budget; gaps addressed in-period.
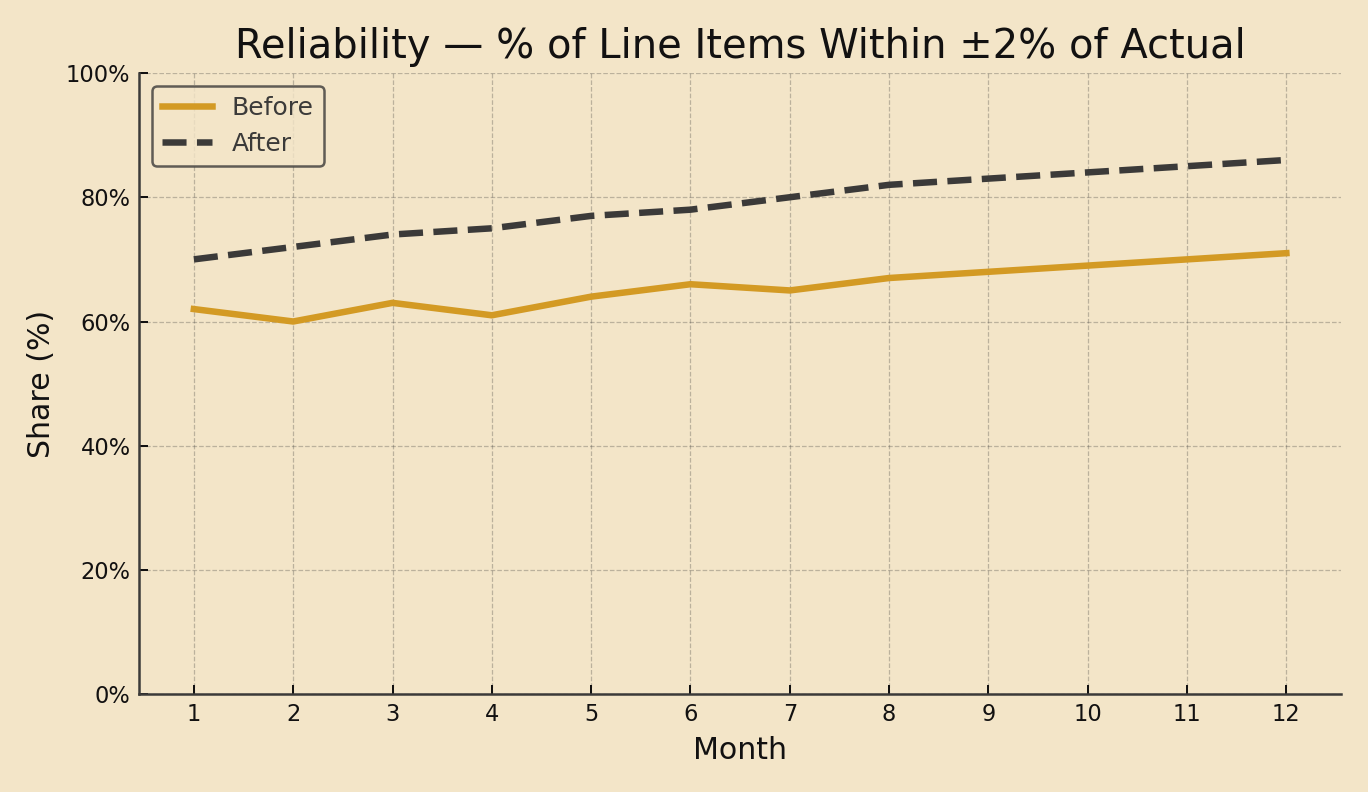
Figure 4 Reliability (% within ±2% of Actual)

Figure notes: Reliability improves as inputs stabilise and assumptions are standardised.
Operating rhythm
- Weekly: Exceptions (largest variances), pipeline deltas, staffing actions.
- Monthly: Scenario deltas vs last month, rate & mix changes, policy updates.
- Quarterly: Structural drivers, capability uplift, tech/data roadmap.
Results
| Metric | Before | After | Comment |
|---|---|---|---|
| MAPE | 12% | 7-8% | Accuracy & bias controls |
| Cycle time (days) | 15 | 7 | standardisation + one model |
| Reliability (±2%) | 65% | 82-86% | Governance + review cadence |
FAQ
- Why a rolling forecast vs a budget? Budgets go stale; rolling updates keep decisions in sync with reality.
- How fast can this start? Begin with CSVs and role templates; automate feeds later.
- How do you keep people on-board? Show time saved and better outcomes; keep governance lightweight.
Glossary
- FP&A: Financial Planning & Analysis: planning, forecasting, decision support.
- MAPE: Mean Absolute Percentage Error: accuracy measure.
- Bias: Average signed error: shows over/under-forecasting tendency.
- Rolling forecast: Continuously updated forecast horizon.
- Reliability: Share of items within a set tolerance of actuals.
See it in action
Want a 15-minute walk-through of how rolling forecasts lift accuracy and speed?