TL;DR
By linking people data (FTEs, utilisation, realisation) to a rolling P&L, a 1,000-staff services firm redistributed capacity and tightened pricing discipline, boosting recovery by 8% and minimising forecast surprises.
Key takeaways
- Small shifts in utilisation and realisation move margin disproportionately.
- A rolling forecast turns reporting into action.
- Quote discipline + scope hygiene reduce hidden write-downs.
- Rebalance capacity before hiring.
- Give managers the levers (+2% rate, ±3pp utilisation) in simple views.
The challenge
- No unified view from staff plan → P&L.
- Pockets of over/under-capacity across business units.
- Discounts/write-downs eroded margin without an early signal.
- Finance reported accurately after month-end; managers needed forward insight.
Executive objectives
- Protect margin during growth: Staff at the right time, in the right units.
- Make discounts visible: Convert “silent write-downs” into transparent realisation decisions.
- Enable managers: Put the levers (utilisation, rates, mix) in the hands of BU leaders.
- Shorten the cycle: Move decisions in period via a rolling forecast not post-month-end.
Our approach
- Workforce model tied to P&L: headcount, start dates, ramp-up and leave phasing; role-based utilisation targets (e.g., producers 75—80%, managers 35—50%1).
- Surface the levers: KPIs (Utilisation, Realisation, Rev/FTE, GM%, EBITDA%), and instant what-ifs (rate ±2%, utilisation ±3pp). Rolling forecasts enable faster, continuous decisions23.
- Pricing governance: realisation checkpoints at quote/approval; clear guardrails on discounts. Realisation = share of standard billable value actually billed/collected4.
- Enable managers: capacity-vs-demand view by BU with alerts.
Methodology & model design (how it actually works)
1) Staffing engine
- Inputs: Planned FTEs by role, start dates, vacancy lead-times, ramp-up curves (e.g., 60% → 80% → 100% over first three months), and leave phasing (annualised days distributed by month).
- Calendarisation: 52-week calendar rolling forward 12—18 months; public-holiday overlay by region.
- Outputs: Available hours and billable capacity by role/BU/month.
2) Utilisation & realisation layer
- Utilisation targets by role (e.g., Consultant 78%, Senior 76%, Manager 45%). Targets can vary by BU seasonality.
- Realisation (recovery): Standard rate × hours → standard value → apply discount/write‑down policy to project billed value, then collections to get collected value.
3) P&L integration
- Revenue:
Collected = Hours × Rate × Realisation × Collection% - Direct cost: Fully loaded salaries (incl. super/benefits), contractors, overtime, bonus accruals.
- Gross margin:
GM% = (Revenue − Direct Cost) ÷ Revenue - EBITDA:
EBITDA = GM − Overheads(non‑people overheads phased to known run‑rates).
4) Data sources
- HRIS for positions/FTE and start dates; PSA/timekeeping for hours; ERP/GL for costs; CRM for pipeline. (Automate later CSV import works on day one.)
KPI formulas & plain‑English examples
- Utilisation (billable) = Billable hours / Available hours. Example: 30 ÷ 40 = 75%.
- Realisation (recovery) = Billed value / Standard value. Example: $92k ÷ $100k = 92%.
- Revenue per FTE = Revenue / FTEs. Example: $5.0m ÷ 25 = $200k/FTE.
- Gross Margin % = (Revenue − Direct cost) ÷ Revenue.
- EBITDA % = EBITDA ÷ Revenue.
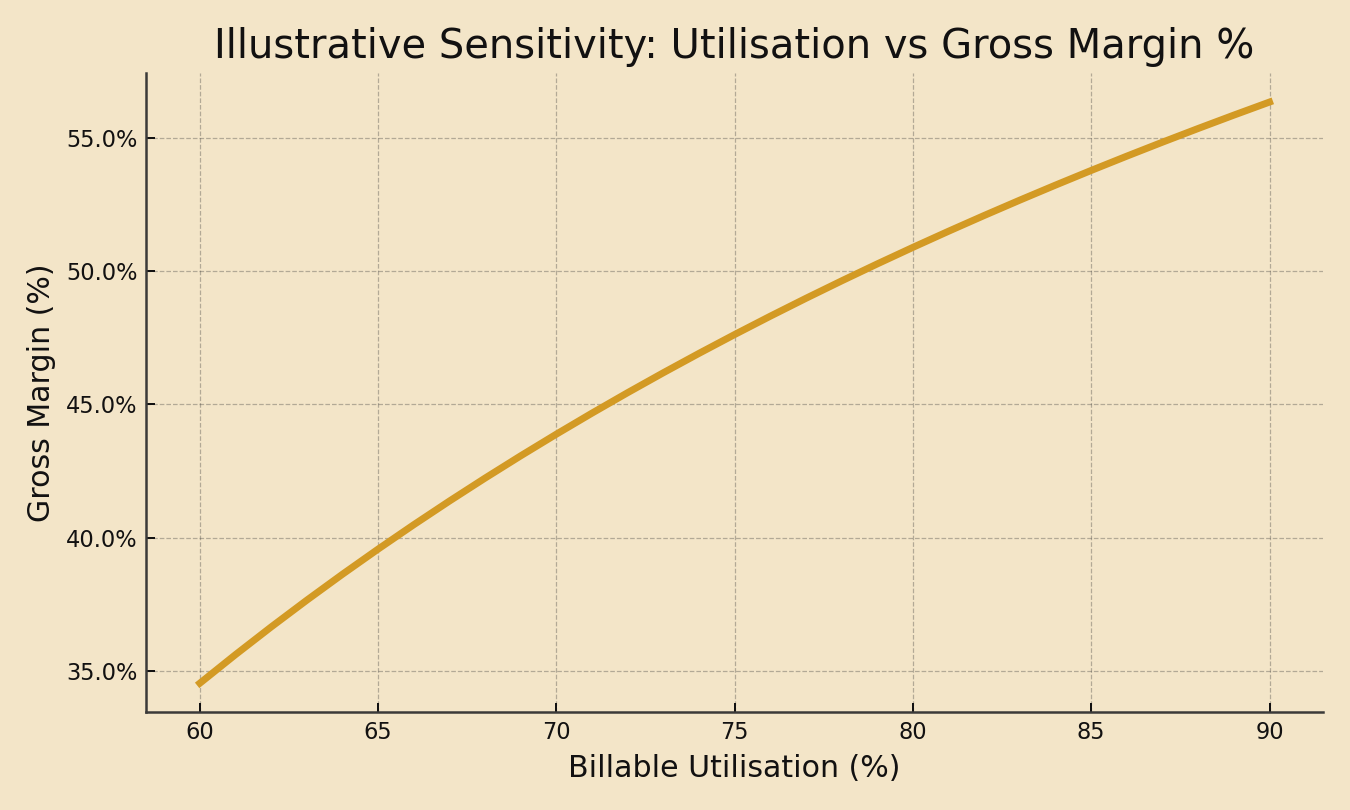
Figure 1 Utilisation vs Gross Margin % (illustrative)

Figure notes: Assumptions for a single FTE: 1,800 hours/year, $220/hr standard, 90% realisation, $140k fully loaded salary. Purpose: small utilisation lifts can materially increase GM% when people costs are semi-fixed in-period.
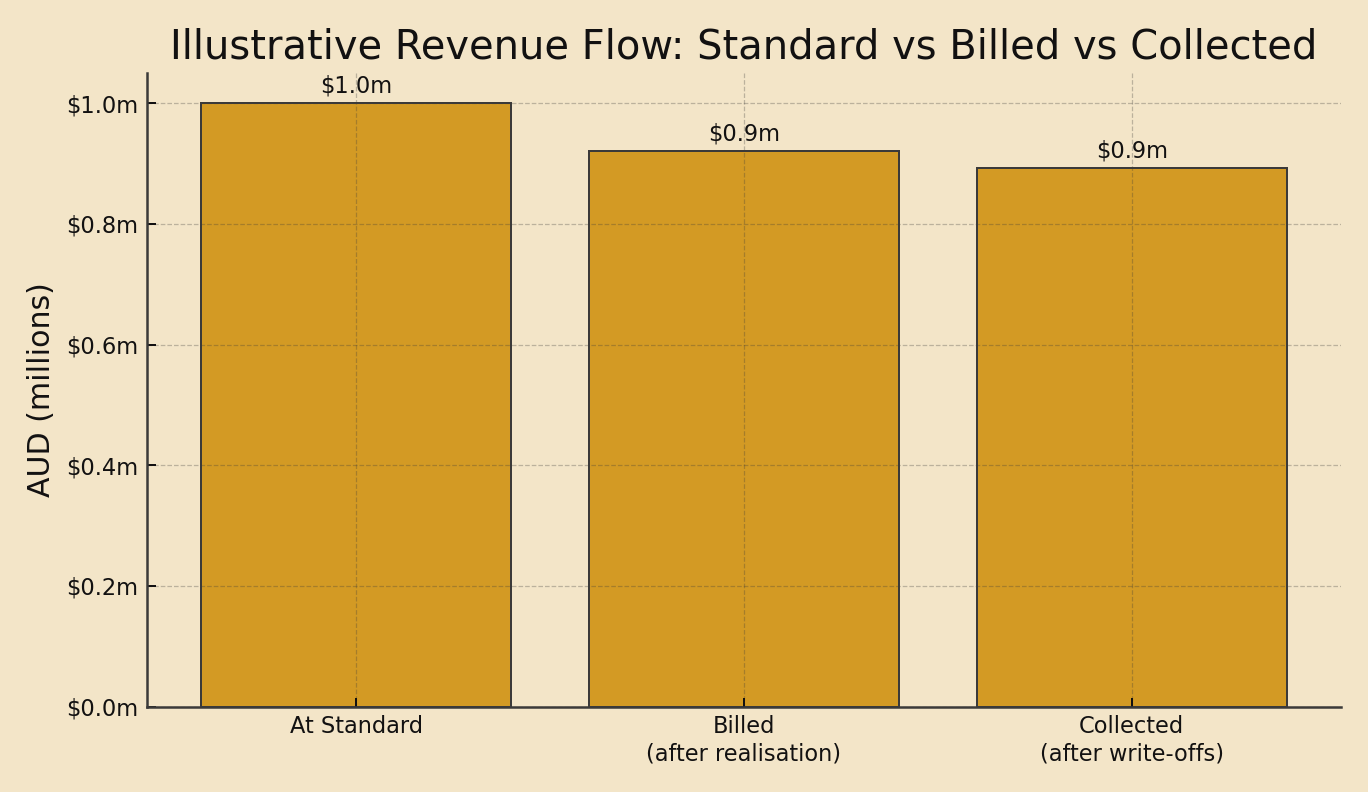
Figure 2 Revenue Flow: Standard → Billed → Collected (illustrative)

Figure notes: Shows how realisation and collections shape final revenue. Definitions per AccountingTools4.
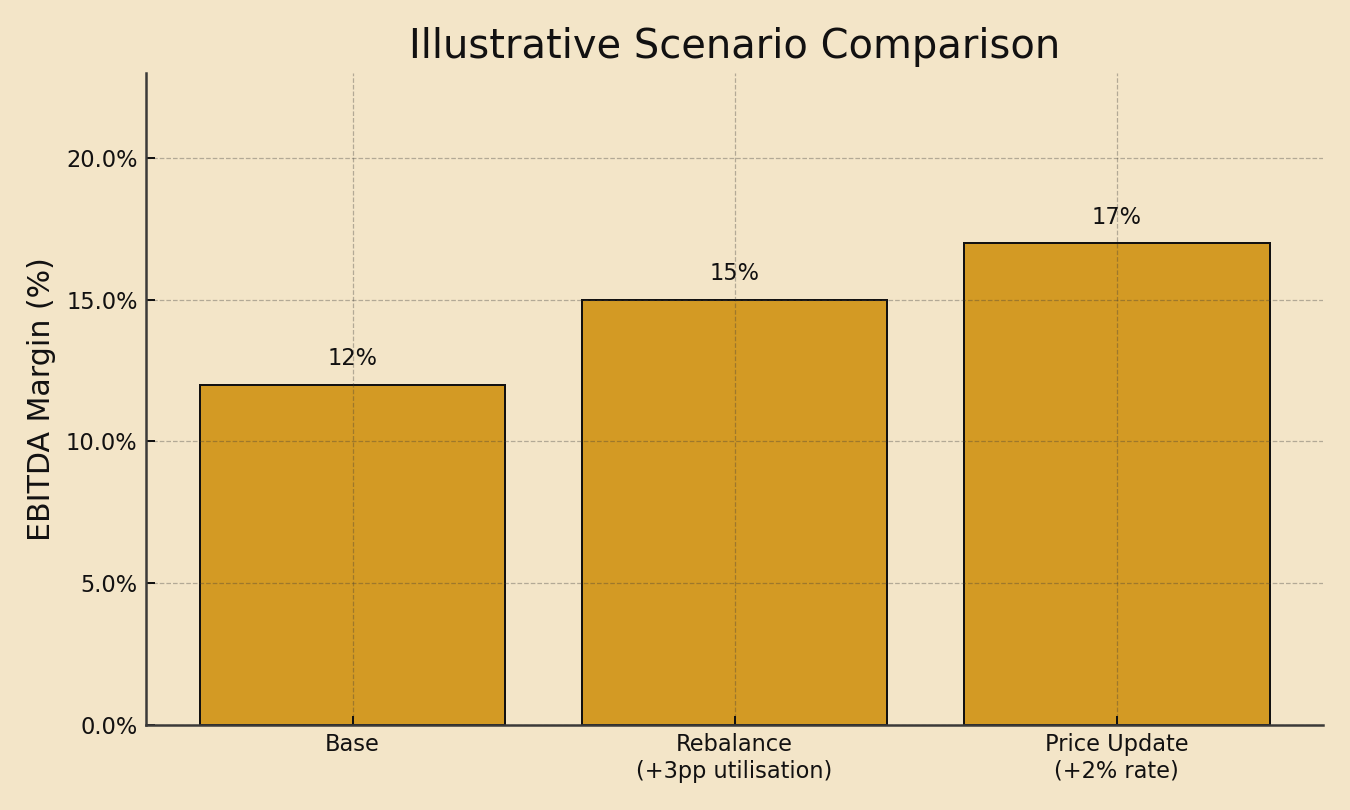
Figure 3 Scenario Comparison (EBITDA %; illustrative)

Figure notes: Illustrates impact of (+3pp utilisation) and (+2% rate). Quantify with your live model by BU.
Pricing & realisation playbook (what managers actually do)
- Quote discipline: Surface a floor rate per role (cost + target GM%). If a quote goes below floor, approval is required.
- Scope hygiene: Lock scope statements in the PSA; changes create visible deltas not silent write-downs.
- Mid-sprint WIP review: For projects at ‰¤85% realisation by mid-month, require a recovery action (scope adjust, price change, or timeline).
- Close-out checklist: Confirm write-downs by reason code to drive coaching (estimation, client change, internal rework).
Capacity rebalancing framework
- Traffic lights per BU: Under-utilised < 72% (green for growth), 72—78% (amber), >78% (red: watch burnout). Targets vary by role tune to your context.
- Actions: Shift pipeline, cross-staff, accelerate starts, or pause recruitment. Tie to rolling forecast so moves update the P&L instantly.
Scenario catalogue (start with five)
- S1 Demand shock (−5% hours) → watch utilisation & staffing lag.
- S2 Price update (+2% rate) → expected uplift to GM% & EBITDA%.
- S3 Mix shift (more senior time) → higher rates but potential realisation risk.
- S4 Cost inflation (+3% salaries) → wage drag; test price pass‑through.
- S5 Hiring lag (+1 month starts) → near‑term margin support vs growth delay.
Operating rhythm (who meets when, about what)
- Weekly (Managers + Finance partner): Capacity vs demand, at-risk projects (realisation), upcoming quotes vs rate floors.
- Monthly (ELT): Scenario deltas, hiring plan updates, rate/discount policy changes, overhead runway.
- Quarterly (Board/Owners): Strategic bets, BU performance distribution, benchmark gaps, client concentration.
Change management & adoption
- Enablement: 45-minute live demo + quick-reference guide for each role.
- Guardrails: One-page discount policy with 3 examples (allowed / exception / no-go).
- Coaching: Monthly review of write-down reasons; celebrate turnarounds publicly.
- Incentives: Align variable comp to balanced KPIs (realisation + client satisfaction), not just billable hours.
Results deep-dive
| Metric | Before | After | Comment |
|---|---|---|---|
| Utilisation (billable) | 74% | 77% | Rebalanced capacity across BUs |
| Forecast cycle time | 10 days | 4 days | Automation + standardised drivers |
| Forecast accuracy (MAPE) | 11.8% | 7.2% | Weekly driver reviews + rolling window |
| Stakeholder satisfaction | 6.5/10 | 8.4/10 | Clear cadence & TL;DR insights |
Lessons for different audiences
- Executives: Treat utilisation/realisation as strategic levers small moves matter.
- Commercial managers: Your day-to-day actions (quotes, staffing, scope) drive the P&L.
- Analysts / early-career FP&A: Focus on bridge stories (what moved and why), not just variance tables.
FAQ (for non‑finance readers)
- Why do small utilisation changes matter so much? People costs are mostly fixed in the short term; tiny shifts change revenue without changing cost.
- Is realisation just “discounting”? It includes discounts and write‑downs from scope creep, rework, or billing policy.
- Why a rolling forecast? Because demand, pricing and hiring move faster than an annual budget-rolling updates keep decisions current.
Glossary (plain English)
- FP&A: Financial Planning & Analysis: planning, forecasting and decision support.
- FTE: Full-Time Equivalent: 1.0 = one full-time person.
- Utilisation (billable): Share of time spent on client-billable work. Typical role targets vary1.
- Realisation (Recovery): Share of standard billable value actually billed & collected4.
- KPI: Key Performance Indicator, a core metric to track performance.
- EBITDA: Earnings before Interest, Tax, Depreciation and Amortisation, a proxy for operating profit.
- Rolling forecast: A continuously updated forecast horizon (e.g., always 12—18 months ahead)2.
Sources & further reading
See it in action
Want a 15-minute walk-through of how utilisation & realisation flow into your P&L?
Footnotes
-
Role‑based utilisation targets: Scoro, “Billable Utilization: Formula, Benchmarks & How to Increase It” (Feb 19, 2025). Producers 75–80%; Managers 35–50%. ↩ ↩2
-
Rolling forecast definition: AICPA & CIMA, “Rolling Plans and Forecasts” (CIMA Official Terminology). ↩ ↩2
-
FP&A agility & practices: McKinsey, “Advanced FP&A practices for a volatile macroeconomic and business environment” (Jul 18, 2024). ↩
-
Realisation definition: AccountingTools, “Realization rate definition” (Jan 4, 2025). ↩ ↩2 ↩3