
Executive summary
- Outcome: faster, more accurate decisions
- Targets: MAPE down 20 to 30 % within two cycles; forecast cycle time down 30 to 50 %; commentary accepted with minor edits at least 60 %
- Risk controls: owners and intended use, model inventory, drift monitoring, change control based on NIST AI RMF
- Scope to start: focus on 1 to 2 P&L lines, 3 to 5 drivers, weekly or monthly refresh cadence
What AI changes now
AI breaks the month-end ritual. It moves FP&A from rebuild and reconcile to continuous, driver-led forecasting and review.
-
Variance surfacing by materiality, not noise.
Models prioritise the few variances that move EBIT or cash, not every anomaly. Teams typically shrink a 100-item review to about 10 to 15 high-impact items. -
Narratives that are review-ready.
First draft commentary is generated and edited by analysts, not written from scratch. McKinsey’s State of AI reports finance teams freeing around 20 % analyst time as narrative automation lands. -
Rolling cadence instead of rebuilds.
With drivers tied to operational systems, AI re-fits volume, rate, utilisation to the latest actuals weekly or monthly. Analysts spend time on options and trade-offs, not plumbing.
The change that matters: AI does not just speed the forecast. It changes the unit of work from whole P&L once a month to micro forecasts by driver.
Guardrails that keep you credible
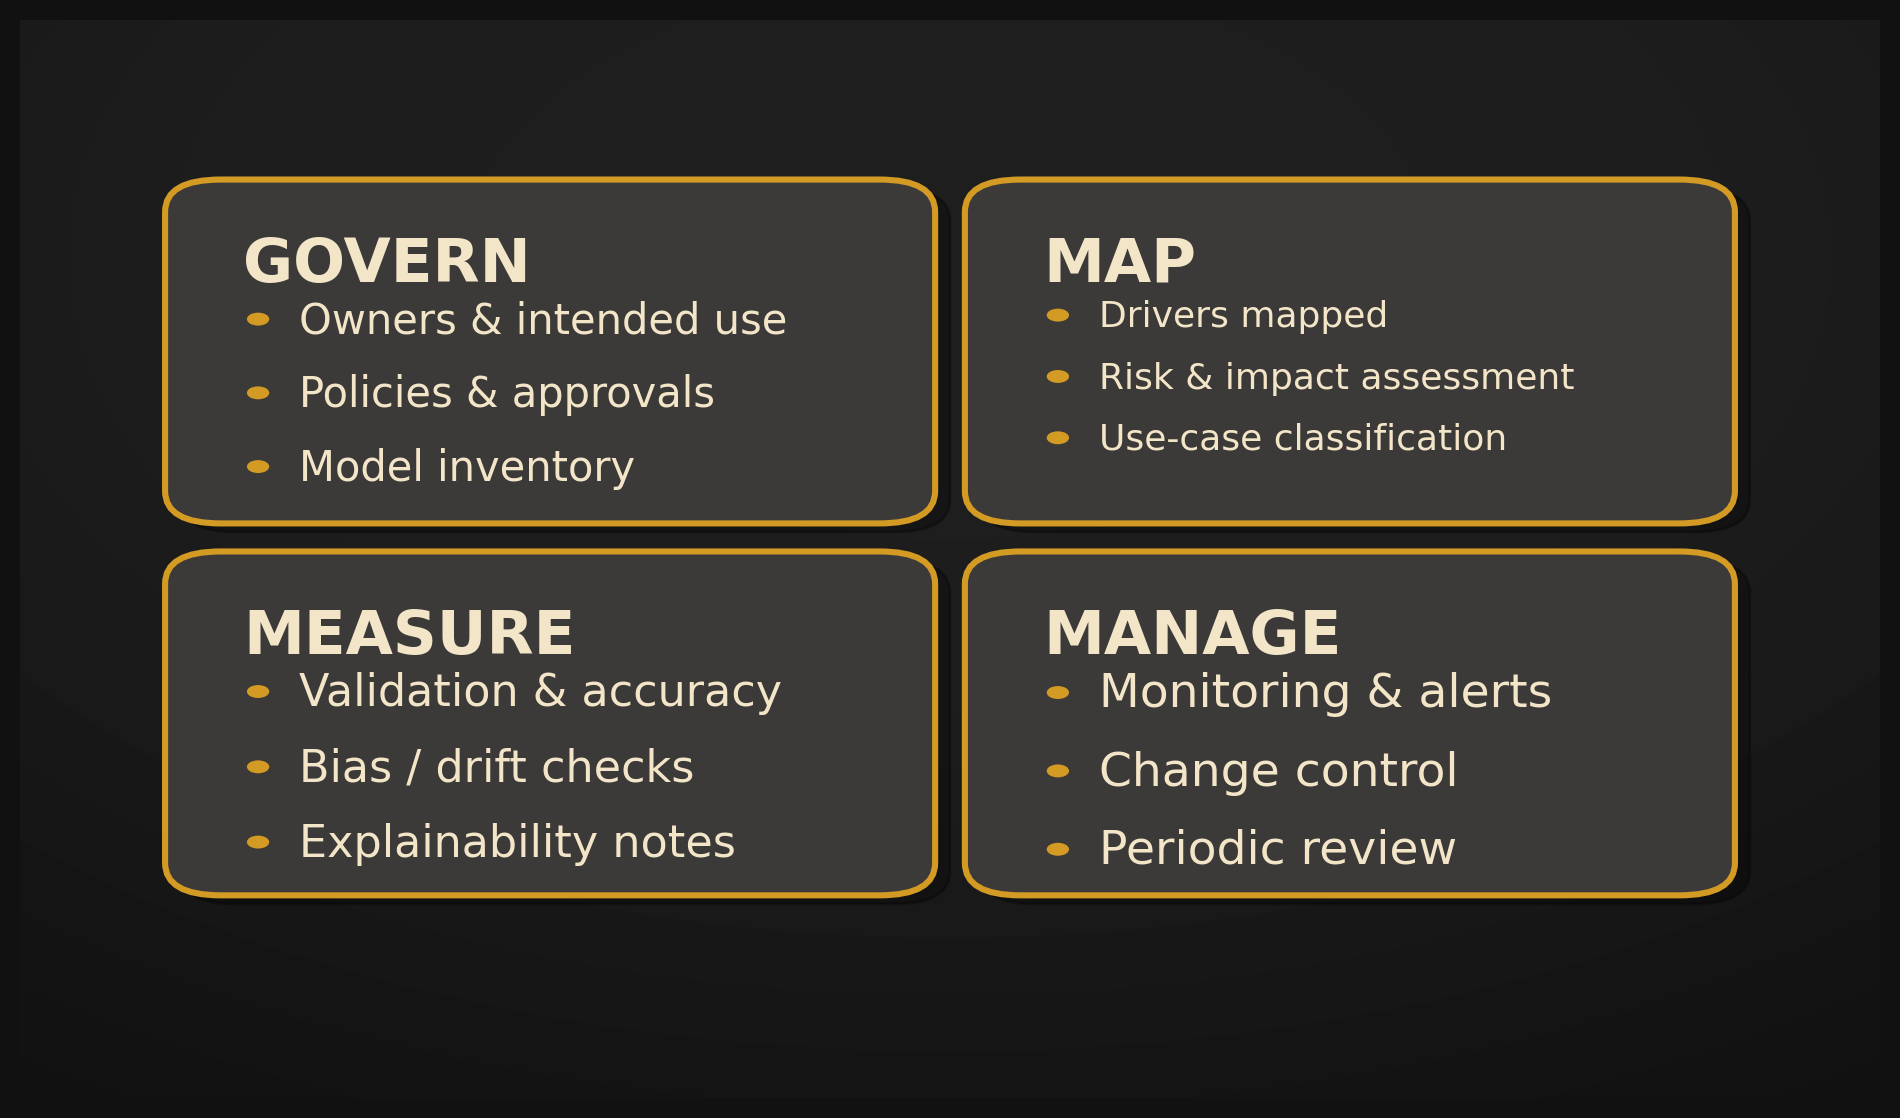
Credibility compounds when models are owned, monitored and reviewable. The NIST AI RMF is a pragmatic blueprint.
-
Govern - owner and intent.
Every model has a named owner and a written intended use. COSO flags orphan models as a top failure mode. -
Map - drivers and limits.
Specify the levers such as volume, rate, productivity, mix, and capacity. State tolerances, for example, plus or minus 3 % revenue and plus or minus 1 % gross margin. -
Measure - accuracy and stability.
Track MAPE or WAPE and drift, such as Z score above two standard deviations across three cycles. PwC finds stability is a better predictor of adoption than accuracy alone. -
Manage - monitor, control, review.
Alerts for failed jobs, stale inputs, and low coverage; change control with pull request, approver, and release notes; quarterly prompt and model review.
Non-obvious risk
AI initiatives fail more from model sprawl than poor accuracy. Maintain a model registry and retire orphans quarterly.
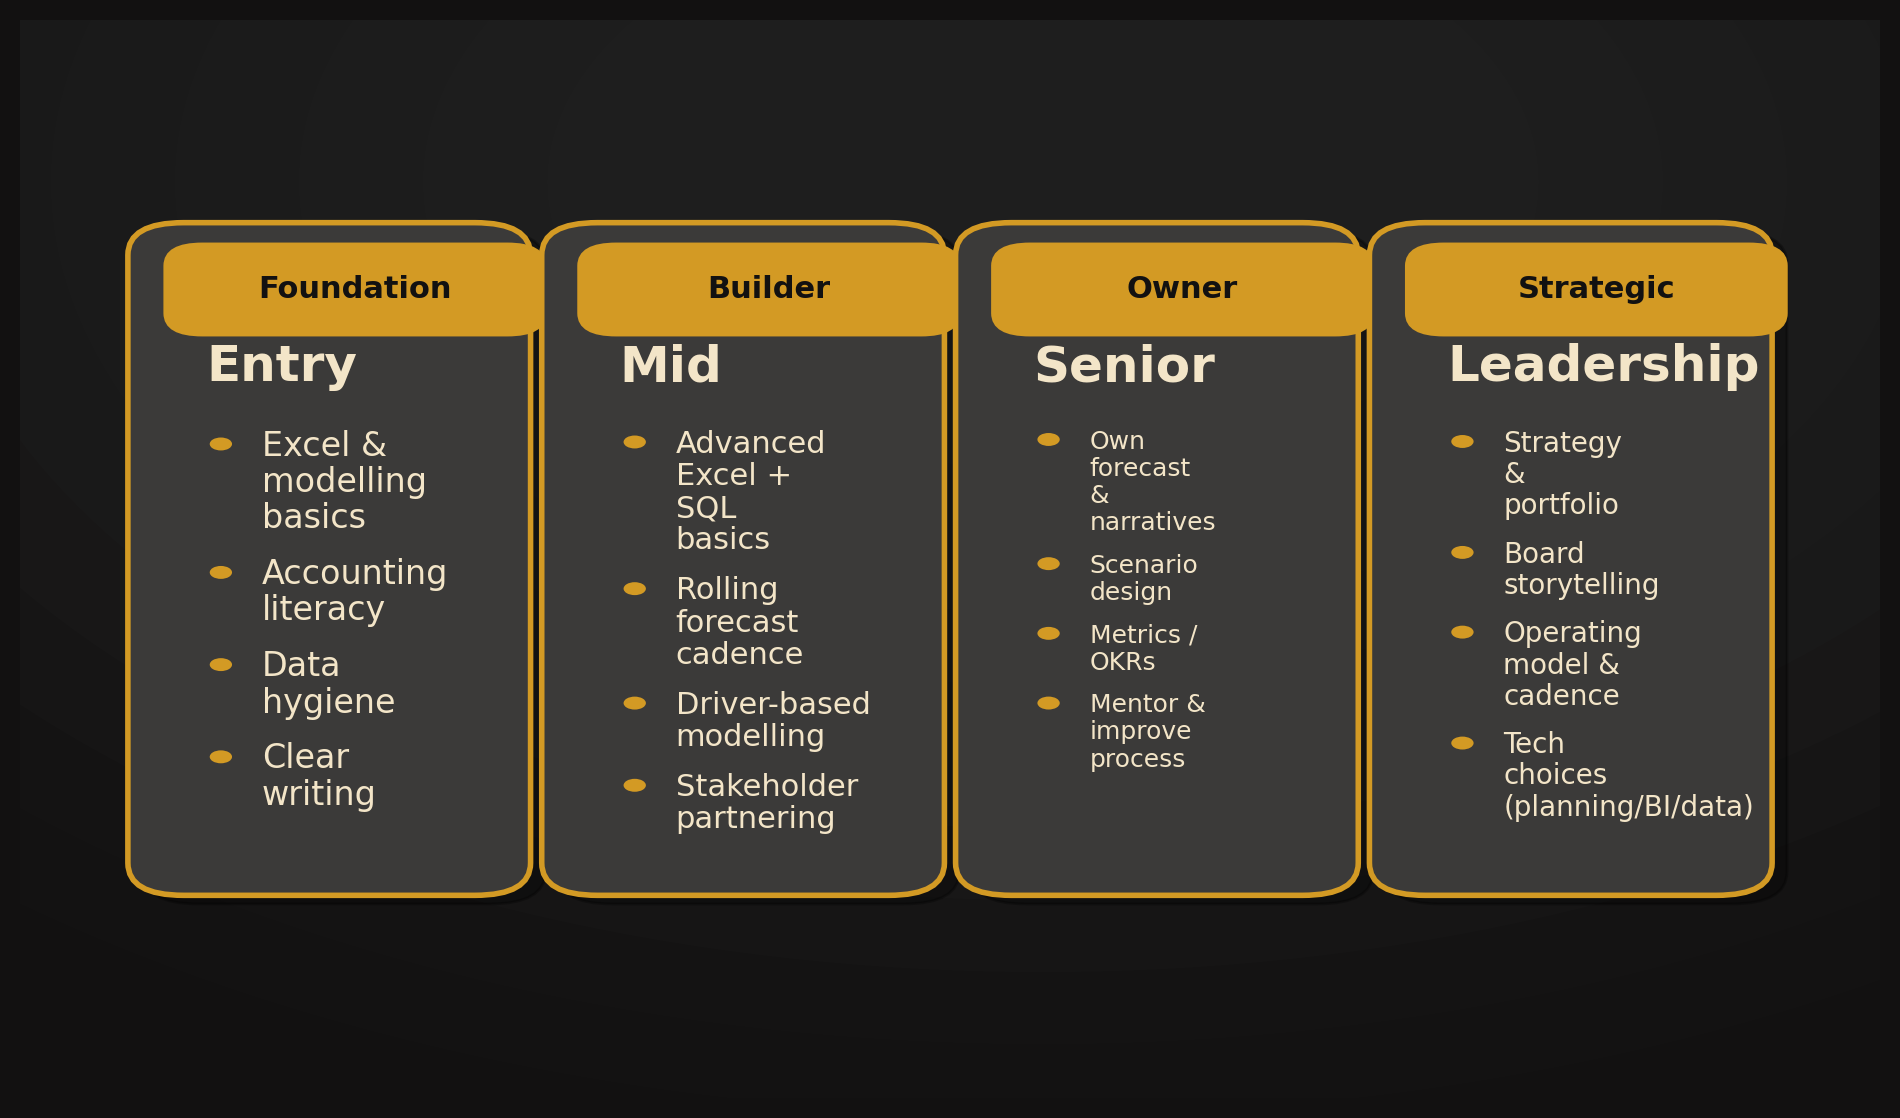
The FP&A skills stack (AI edition)
Board lens: This is how capability scales, from reliable inputs to strategic leverage.
Entry - Foundation
- Excel and prompt hygiene
- Accounting literacy with attention to cash timing
- Data hygiene and outlier checks
- Clear writing that explains what changed, why, and now what
Mid-Builder
- Driver mapping, three to five levers that actually move P&L
- Cadence design, weekly for volume and utilisation, monthly for price and mix
- Light SQL for validation
- Partnering: one page packs per BU, drivers, deltas, asks
Senior - Owner
- Board liftable narratives, five lines
- Scenario design using real managerial levers
- Metrics that discourage gaming, accuracy, stability, plus coverage
- Mentor the process and declare assumption breakpoints
Leadership - Strategic
- Portfolio of models with lifecycle and deprecation plan
- Risk appetite statements for AI, what must stay human in the loop
- Operating model: small central standards and federated builders
- Tech choices that favour governance over novelty
Diagnostic that unlocks progress
List your top five drivers. For each, record the data source, refresh cadence, owner, and accuracy target. Anything without an owner is a risk, not a capability.
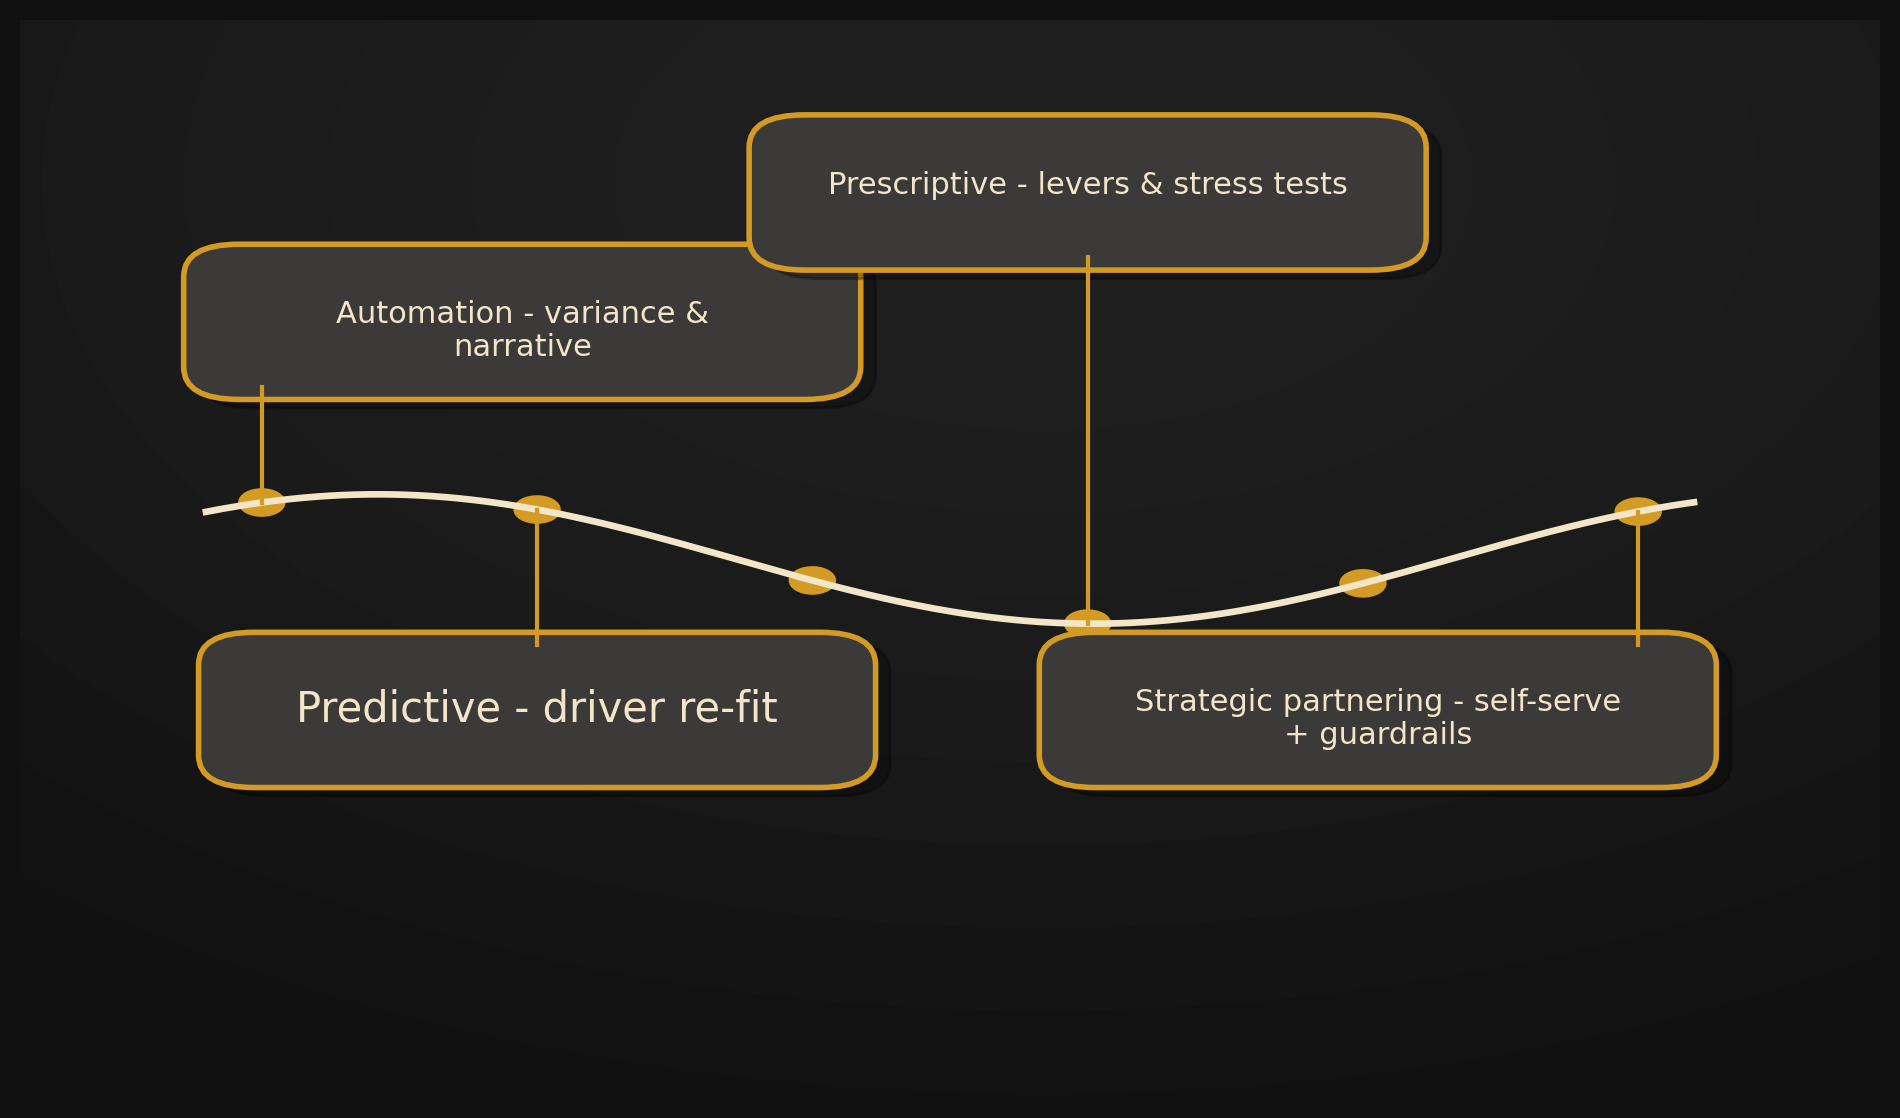
Near-term operating model, 2025 to 2030
2025 to 2026 - automation and predictive re-fit
- Outcomes: material variance surfacing, re-fit of three to five drivers, draft commentary
- Avoid: rebuilding the whole forecast monthly. Let drivers update.
- KPI: cycle time down 30 to 50 %, commentary acceptance at least 60 %
2027 to 2028 - prescriptive levers and stress tests
- Outcomes: scenario levers exposed to business partners, pricing, mix, hiring; what would it take pack
- Guardrail: human in loop for changes moving revenue above 0.5 % or gross margin above 0.2 points
- KPI: decision lead time down 25 to 40 %
2029 to 2030 - strategic partnering with guardrails
- Outcomes: self-serve analysis with policy-encoded guardrails
- Operating model: central finance sets standards, BUs run micro forecasts, board sees one coherent story
- KPI: drift alerts resolved within one cycle at least 90 %
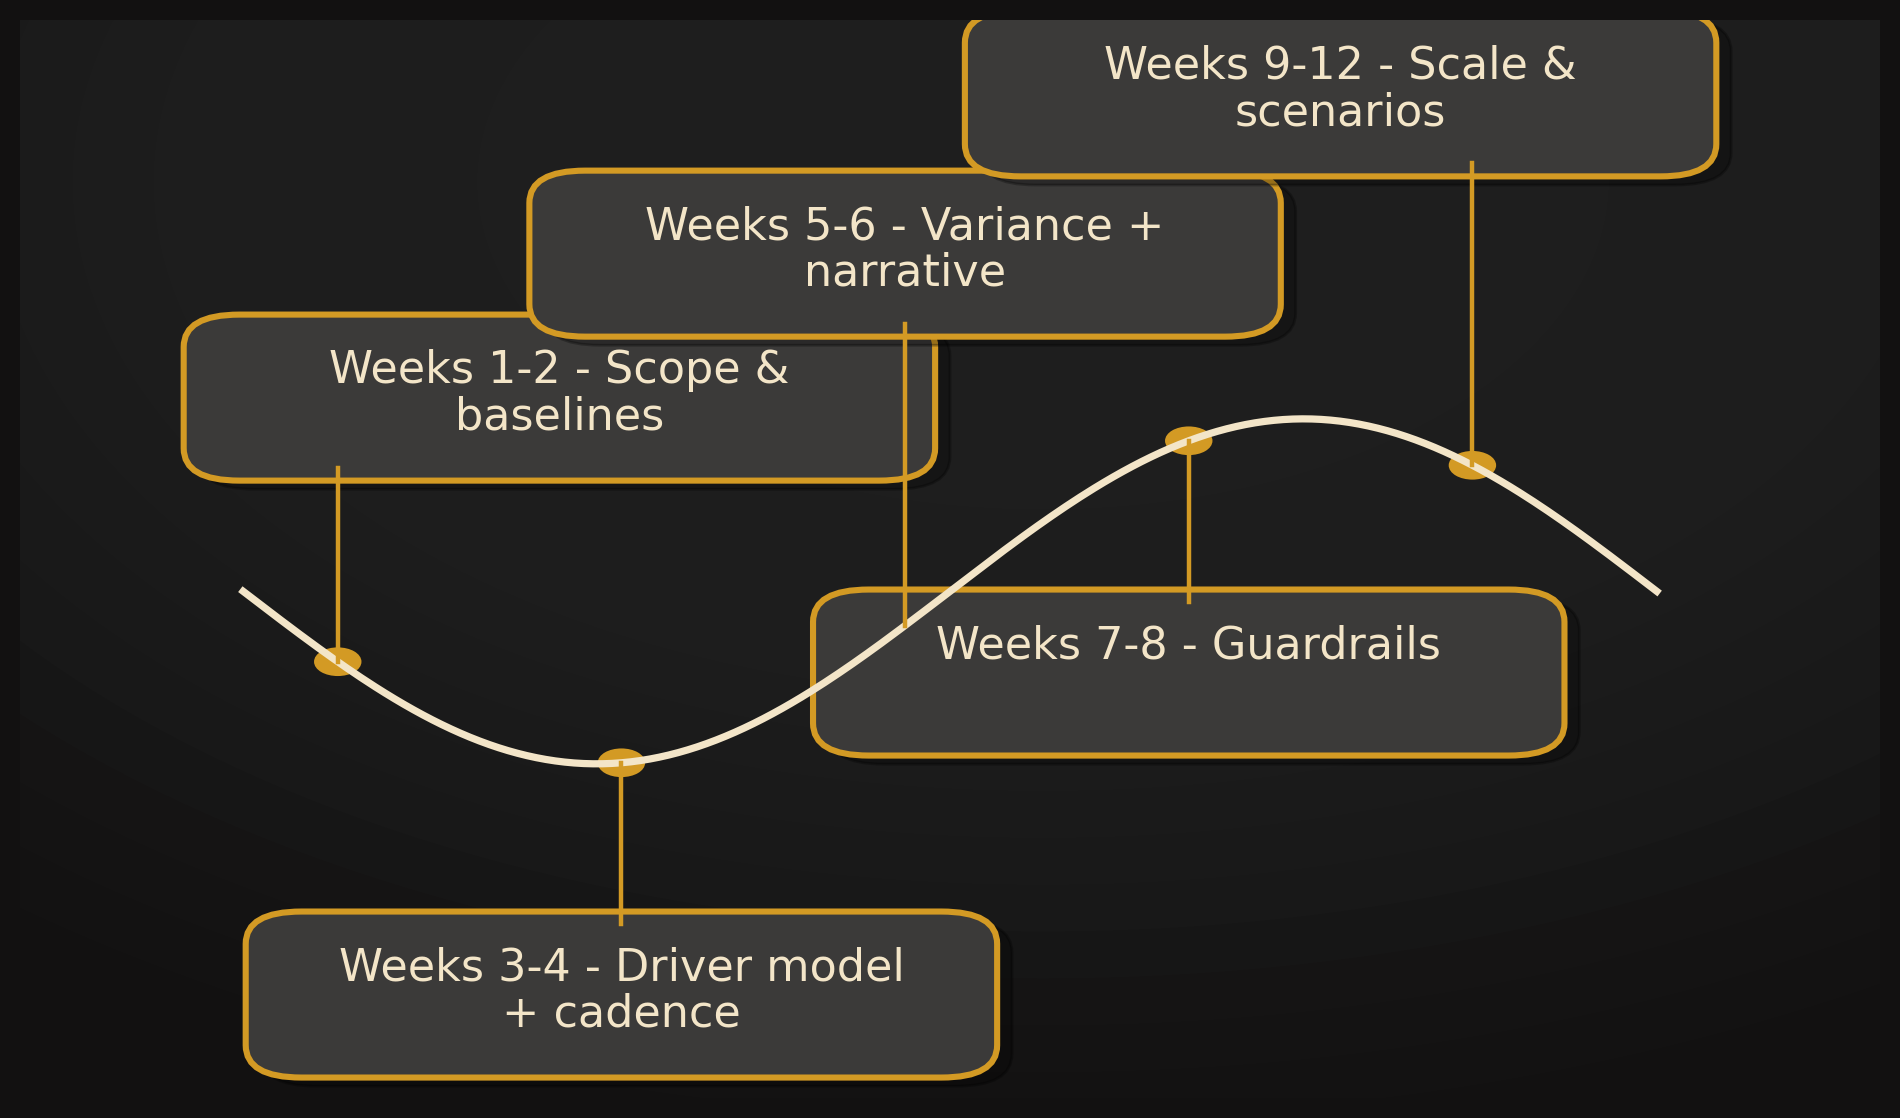
A pragmatic path, 6 to 12 weeks
Weeks 1 to 2 - scope and baselines
Freeze MAPE and WAPE by BU and log the current cycle time. Deliverable: one-pager with drivers, cadence, owner, and the baseline dashboard.
Weeks 3 to 4 - driver model and cadence
Wire three to five drivers and schedule updates at driver cadence. Deliverable: automated refresh with an accuracy chart and a Definition of Done.
Weeks 5 to 6 - variance surfacing and narrative
Set materiality thresholds, for example, EBIT impact above 0.5 %, and a reviewer workflow. Deliverable: % of commentary accepted with minor edits.
Weeks 7 to 8 - guardrails and drift
NIST controls in place, drift widget, change control with pull request, approver, and release notes.
Weeks 9 to 12 - scale and scenarios
Add BU levers with policy limits. Publish the How we forecast playbook and set a quarterly review cadence.
Acceptance criteria to declare success
- MAPE or WAPE improvement at least 20 % within two cycles
- Forecast cycle time down at least 30 %
- Drift alerts resolved within one cycle
- Stakeholder satisfaction at least 4 out of 5 on clarity and usefulness
Evidence and further reading
- NIST (2023) - AI Risk Management Framework 1.0
- COSO (2024) - Realize the Full Potential of AI
- McKinsey (2023 to 2024) - State of AI, finance productivity and cycle time
- PwC (2024) - Finance AI Survey, trust and stability
Related reading
Work with Numerroo
Board briefing: AI in FP&A, 30 minutes
We will review your current forecast cadence and stability, set targets, and agree a 6 to 12 week plan with guardrails.
Contact: hello@numerroo.com.au · /contact